You’re going to find it difficult to debug Tailwind styles — and even harder if you mix Tailwind and CSS.
Thankfully, there’s a way.
But let’s take a look at debugging pure Tailwind first.
Debugging Tailwind
Let’s say you have this code:
<div class="p-4 bg-blue-300 text-blue-900">...</div>Debugging this code already begins to get difficult because you’ll have to look through many selectors in the inspector to see what’s going on.
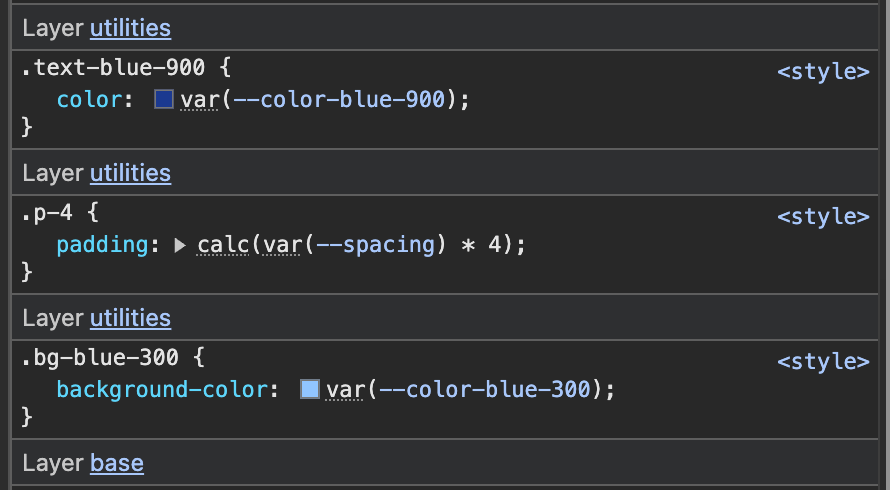
If you compare it with debugging vanilla CSS — where you have all your styles in one selector — you’ll see why Tailwind is difficult to debug.

Because of this, developers have built solutions like Gimli (free) and Tail Lens (paid) that help with Tailwind’s debugging issue.
Debugging Both Tailwind and CSS
If debugging Tailwind is challenging, debugging Tailwind and CSS might be a pain in the ass — especially if you sprinkle CSS variables on top of them (which I do in my Unorthodox System).
Thankfully, the inspector contains a relatively less used (built-in) feature — the computed tab — that solves this problem. Watch the video below to see how I use it.
Welcome! Unfortunately, you don’t have access to this lesson. To get access, please purchase the course or enroll in Magical Dev School.
Unlock this lesson