The console is a place that lets you find out what’s happening with your JavaScript code. It’s a useful tool you’ll keep using to check and eliminate errors (a process also known as debugging).
Browsers have their own console:
Browsers have their own console. The consoles between browsers are largely similar to each other, with minor differences in style and capabilities. The best browsers for debugging are Firefox and Chrome.
Personally, I use Google Chrome Canary and Firefox Nightly when I code because their consoles are superior compared to other browsers. I highly recommend you use one of these.
This is how a console looks like.

Bringing up the console
You can open the console through keyboard shortcuts:
- Mac:
cmd + opt + i - Windows:
ctrl + shift + i
The same shortcut work on almost all browsers on the same operating system. I recommend learning the shortcut because you’ll be using the console — a lot.
Alternatively, you can open up the console in Chrome and Firefox through the following ways:
- Chrome:
view > developer > developer tools - Firefox:
tools > web developer > web console
Typing in the console
You can type in the console. If you typed valid JavaScript into the console, it will be evaluated and the results would be shown to you, like this:

If you typed invalid JavaScript into the console, you would get an error, like this:

Every error the console throws at you has a meaning. You can use it to debug and make things right, and you’ll learn how to do so in later chapters.
For now, just know that you can type JavaScript into the console.
Printing to the console
Code you type into your JavaScript file does not appear automatically in the console.
This behavior is ideal because you can have hundreds of lines of JavaScript in a real project — it would be hard to debug if you were forced to look at hundreds of lines of logs every time!
To get things from your JavaScript file to the console, you need to use console.log. It looks like this:
console.log(`Hello, I'm Zell!`)
Note: whenever I mention “log into the console” in this course, I mean for you to write a console.log statement, just like you did above.
File not found error
Sometimes, when you open up your console, you’ll see an error that says ERR_FILE_NOT_FOUND.

If you see this error, it means you wrote a URL in your HTML file that points to a location which contains nothing.
This is often due to a typo error so you can just go back to your HTML file and correct the URL. For example, if you look at the URL you can see that I misspelled the word main as maainon the 9th line of the index.html file
Saving and refreshing
When you change your JavaScript file, you need to save it. After saving it, you need to refresh your browser window for the changes to take effect.
This is one of the most common errors that people face when they find their JavaScript didn’t work — they either forget to save, forget to reload, or both.
So next time, when your code doesn’t update, try saving and refreshing.
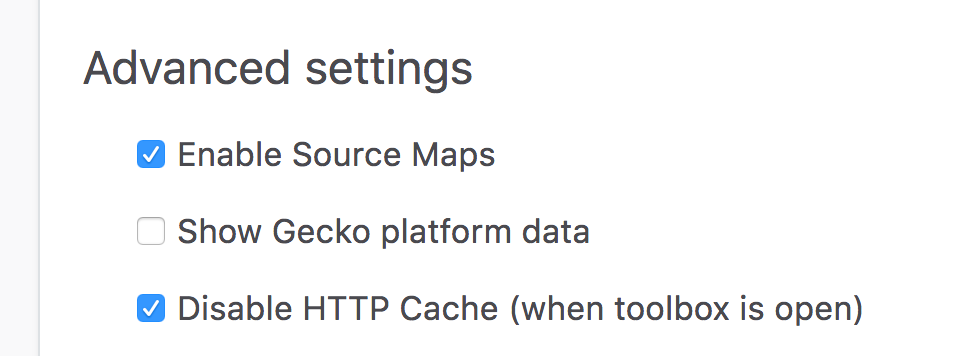
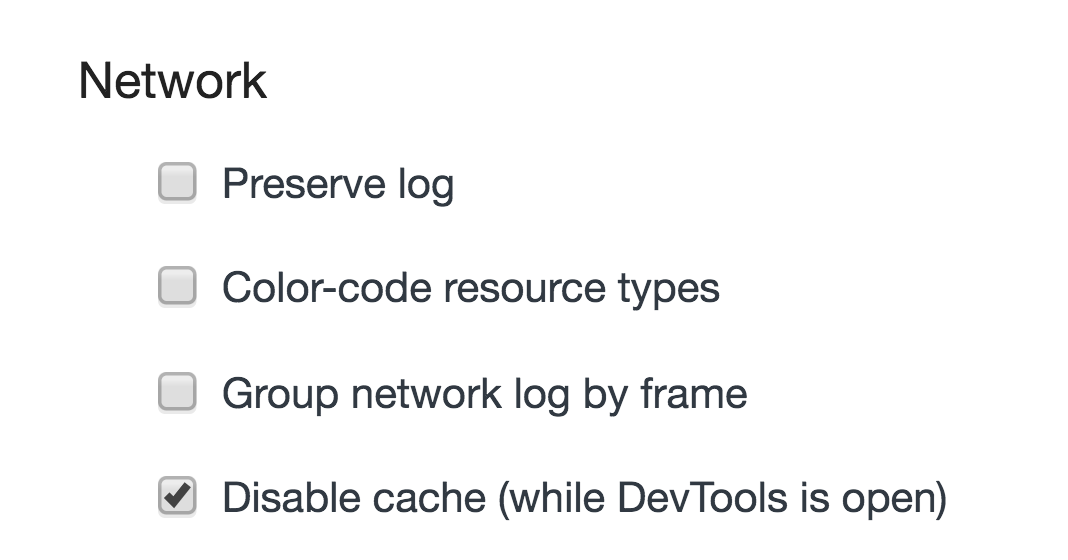
Another major error most people face when debugging JavaScript is that they have the cache turned on — when this is turned on, browsers will prefer using the old versions that they’ve already received from you, so they can serve things up faster for users.
So when you code, you need to make sure you turn off your cache. You can do this easily by:
- Keeping the console open when you code
- Make sure “Disable HTTP Cache” is checked in your console settings


Exercise
You’ll use the console a lot as you go through the next few lessons. Try the following tasks:
- Bring up the console with the keyboard shortcut
- Close the console again with the same shortcut
- Type 1 + 1 in the console and see what you get
- Type 1 + 1 in your JavaScript file and see what you get in your console
- Type
console.log('I am writing JavaScript!')into your JavaScript file and see what you get in your console
Welcome! Unfortunately, you don’t have access to this lesson. To get access, please purchase the course or enroll in Magical Dev School.
Unlock this lesson