Developer tools are built into the browser and lets web developers inspect, modify and debug any website. All the modern browsers have their own version of Devtools, with some minor feature differences, but for the most part, they serve the same purpose.
Even if you eventually stop developing websites in future (because who knows what might happen), knowledge of Devtools will remain useful, especially when you run into the occasional buggy website which isn’t working properly and preventing you from getting things done. So even if you never finish this course, consider at least finishing this chapter.
Accessing Devtools
Regardless of which desktop browser you are using at the moment, odds are it comes with Devtools. Yes, even if you are still using Internet Explorer (but please do consider switching to Edge or another modern browser, security being a major reason).
There are multiple ways to access Devtools, no matter which browser you’re using.
Chrome
You can either:
- Right-click any element on a web page and select Inspect from the context menu
- Use the keyboard shortcut of Ctrl+Shift+C (on Windows/Linux) or Cmd+Shift+C (on Mac)
- Click on the 3 vertical dots on the top-right corner of Chrome, go to More Tools, then click on Developer Tools
For more detailed guidance, go to https://developer.chrome.com/docs/devtools/open/
Edge
You can either:
- Right-click any element on a web page and select Inspect from the context menu
- Use the keyboard shortcut of Ctrl+Shift+I (on Windows/Linux) or Cmd+Shift+I (on Mac)
- Use the keyboard shortcut of F12
- Click on the 3 horizontal dots on the top-right corner of Edge, go to More Tools, then click on Developer Tools
For more detailed guidance, go to https://docs.microsoft.com/en-us/microsoft-edge/devtools-guide-chromium/open/
Firefox
You can either:
- Right-click any element on a web page and select Inspect from the context menu
- Use the keyboard shortcut of Ctrl+Shift+I (on Windows/Linux) or Cmd+Shift+I (on Mac)
- Use the keyboard shortcut of F12
- Click on the 3-line icon on the top-right corner of Firefox, go to More Tools, then click on Web Developer Tools
For more detailed guidance, go to https://developer.mozilla.org/en-US/docs/Tools
Safari (only for Mac)
If you have never accessed Safari’s Developer Tools before, you will have to go to Preferences, click Advanced, then make sure the “Show Develop menu in menu bar” option is checked.
You can either:
- Right-click any element on a web page and select Inspect Element from the context menu
- Use the keyboard shortcut of Option+Cmd+I
- Click on Develop in the menu bar then click on Show Web Inspector
For more detailed guidance, go to https://developer.apple.com/safari/tools/
Key features
There is no recommended browser that is best for web development, if anything, it is advisable to use a variety of browsers throughout the process, just to make sure you don’t run into any obscure browser specific bugs. That being said, most people will have a preferred browser they default to.
Even though every browser’s Devtools user interface is slightly different, they have kindly used similar labels and terminology for the most commonly used features. You should still be able to follow along regardless of what your preferred browser is.
Inspecting elements
When you right-click an element and inspect it, the Devtools will highlight the line of code for that particular element.
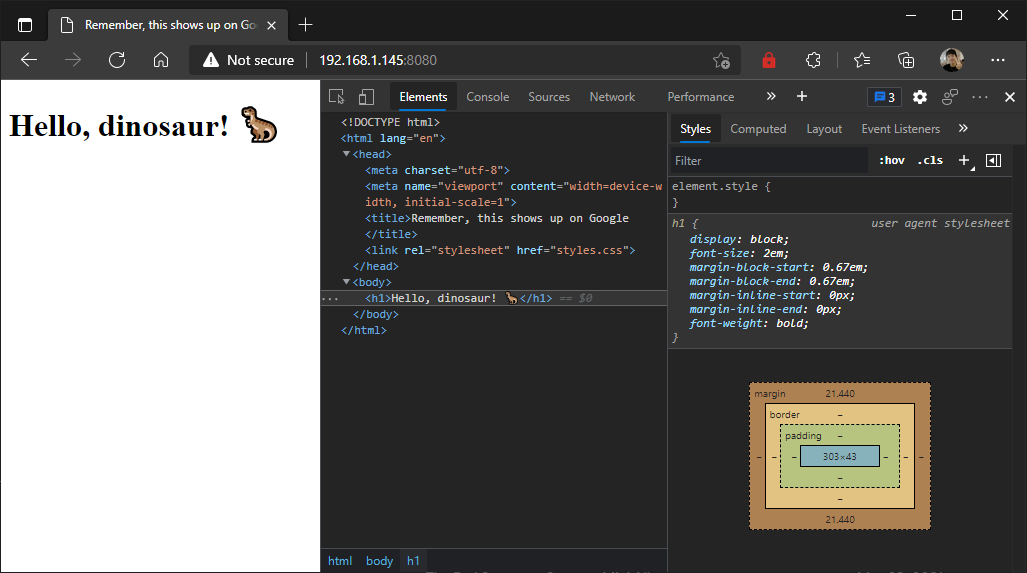
All the browsers’ Devtools will show you the code for the web page, as well as which CSS style rules apply to the selected element. Chrome, Edge and Safari use the tab name Elements for the source code, while Firefox uses the tab name Inspector.
There will be another set of tabs that tell you all sorts of information about the highlighted element. The first of those tabs will show you the style rules that are being applied. Firefox uses the tab name Rules, while Chrome, Edge and Safari use the tab name Styles.
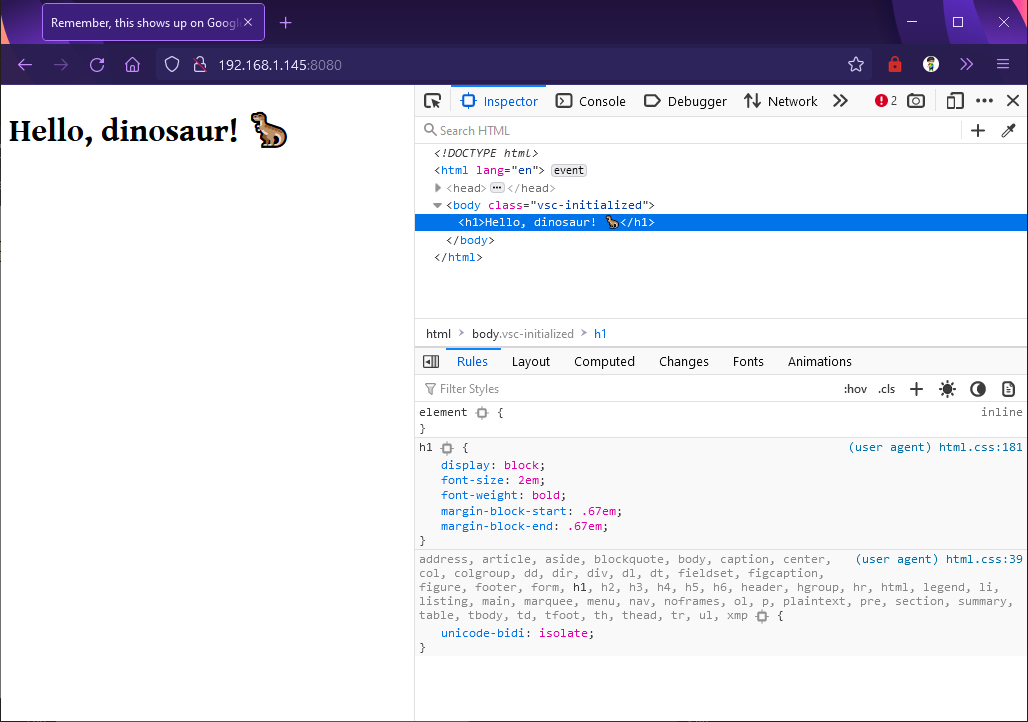
The order in which these style rules appear reflects the cascade in action. If you are unfamiliar with the cascade, we cover this rather comprehensively in the next section, Key concepts of CSS. Devtools will display the all the style rules that apply to the element in order of “strength”, which is determined by selector specificity, origin and order of appearance
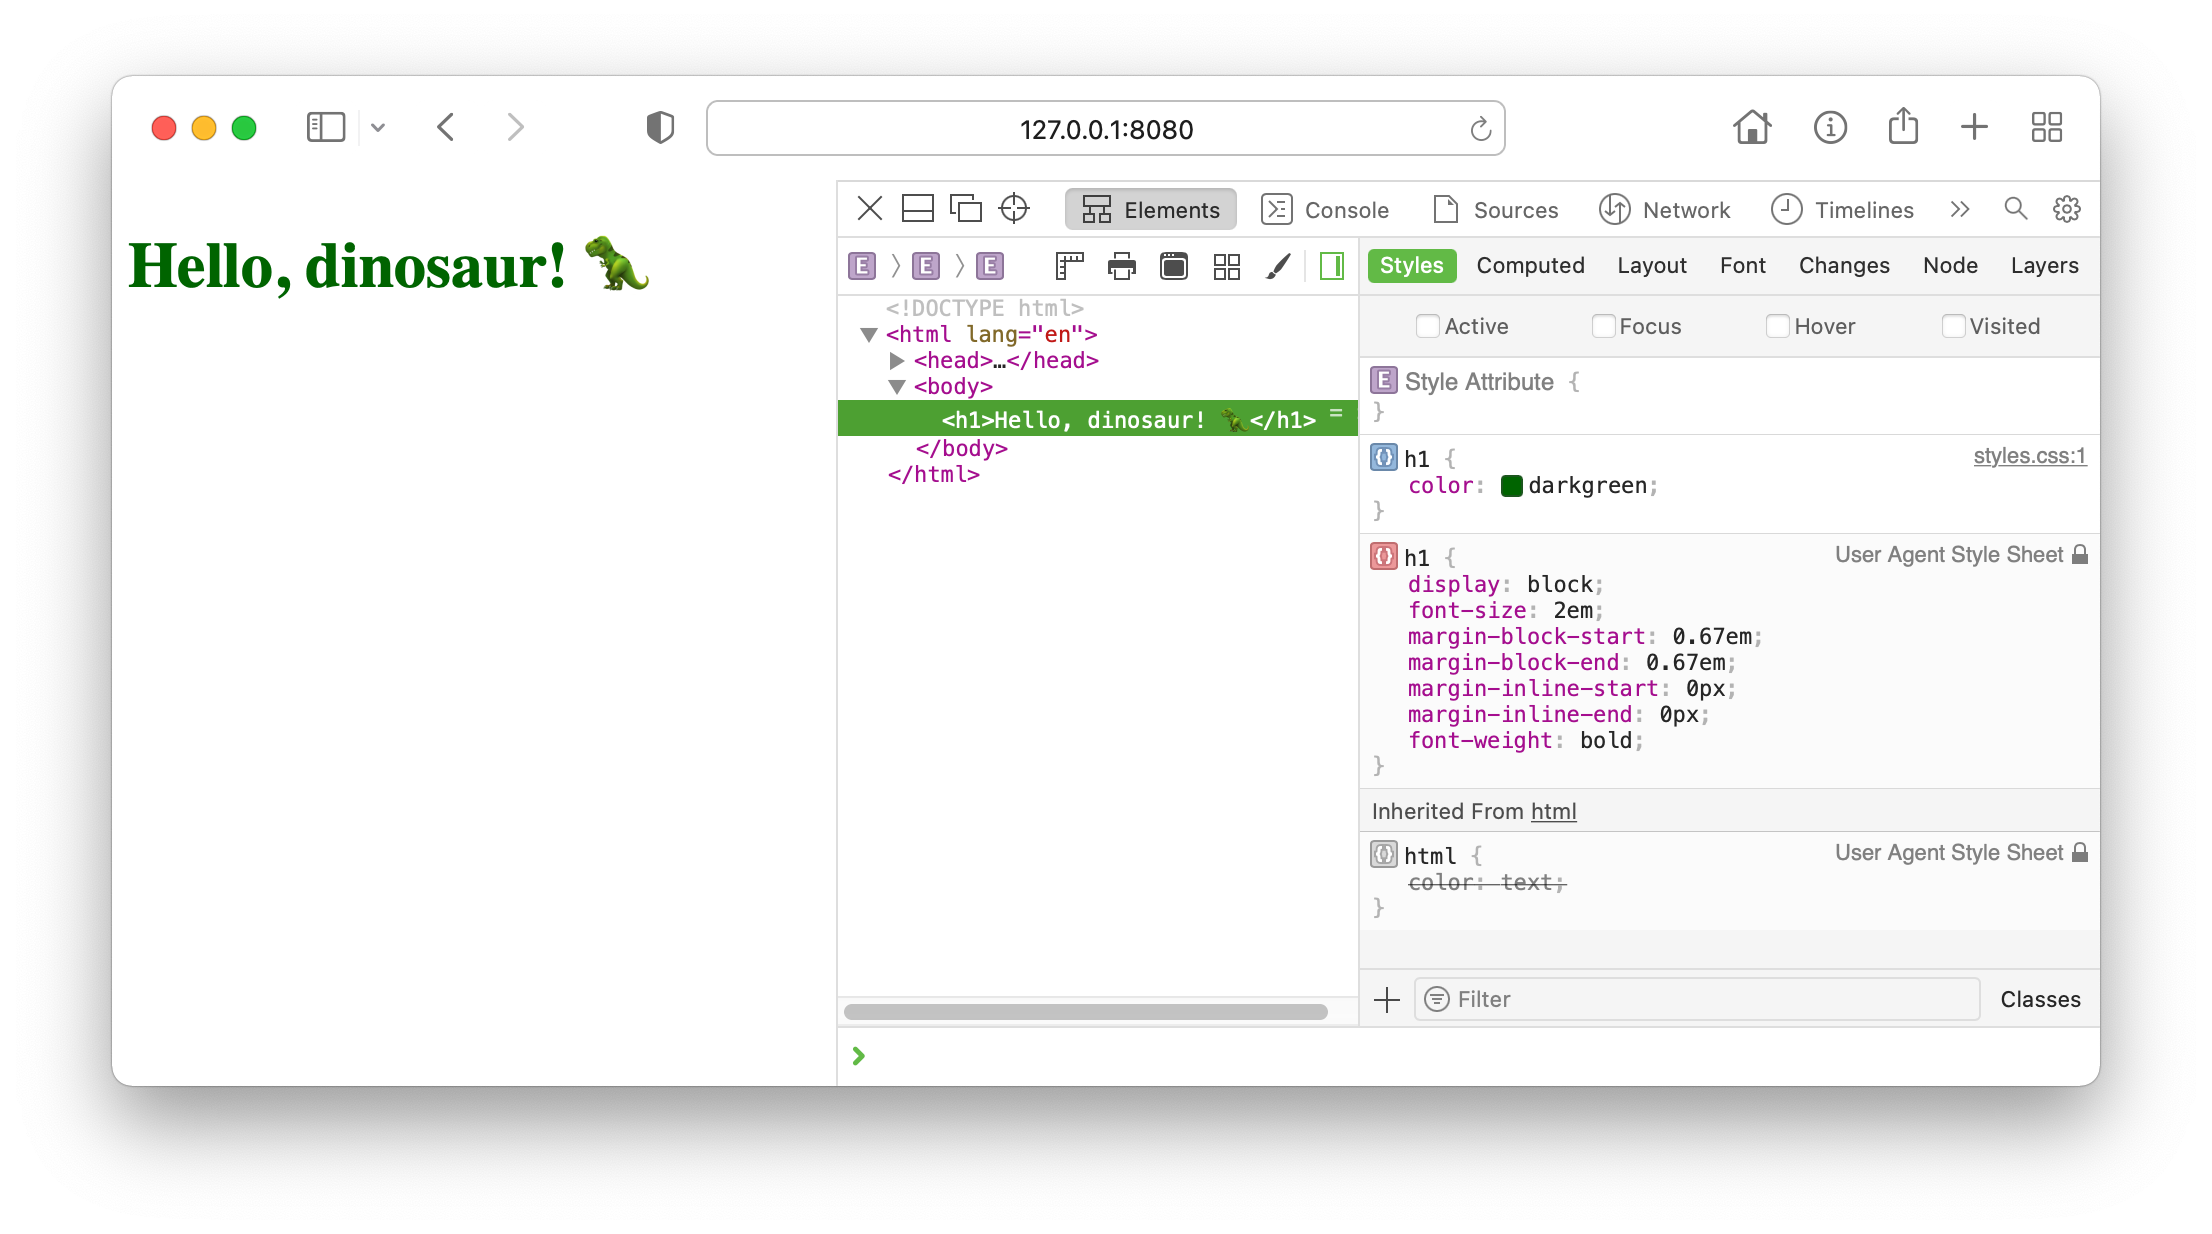
This gives us a visual indicator of which rules are overriding which others, and where these rules are coming from. On the right of the selector, you can see the file name of the CSS stylesheet where the rule resides. Clicking on it will display the entire CSS file, so you can locate the style rule you wish to debug more easily.
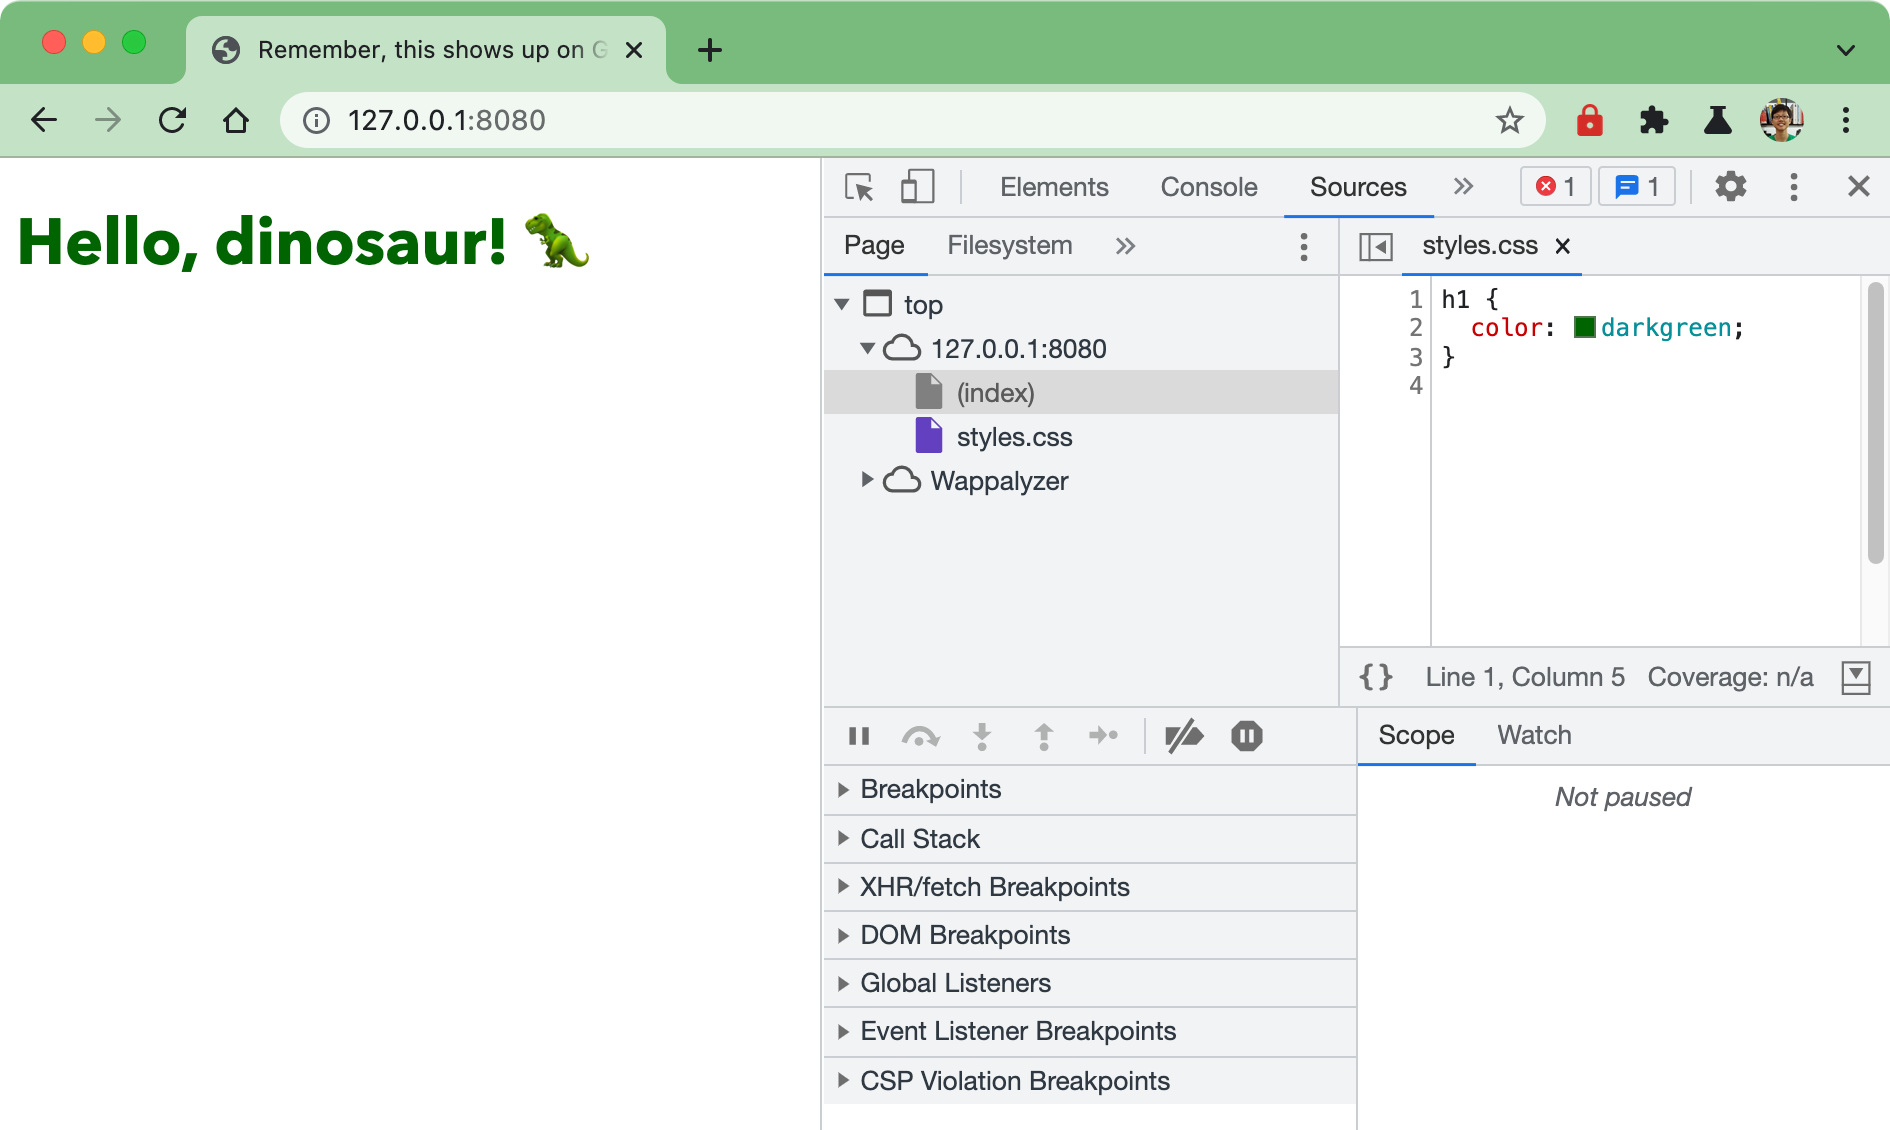
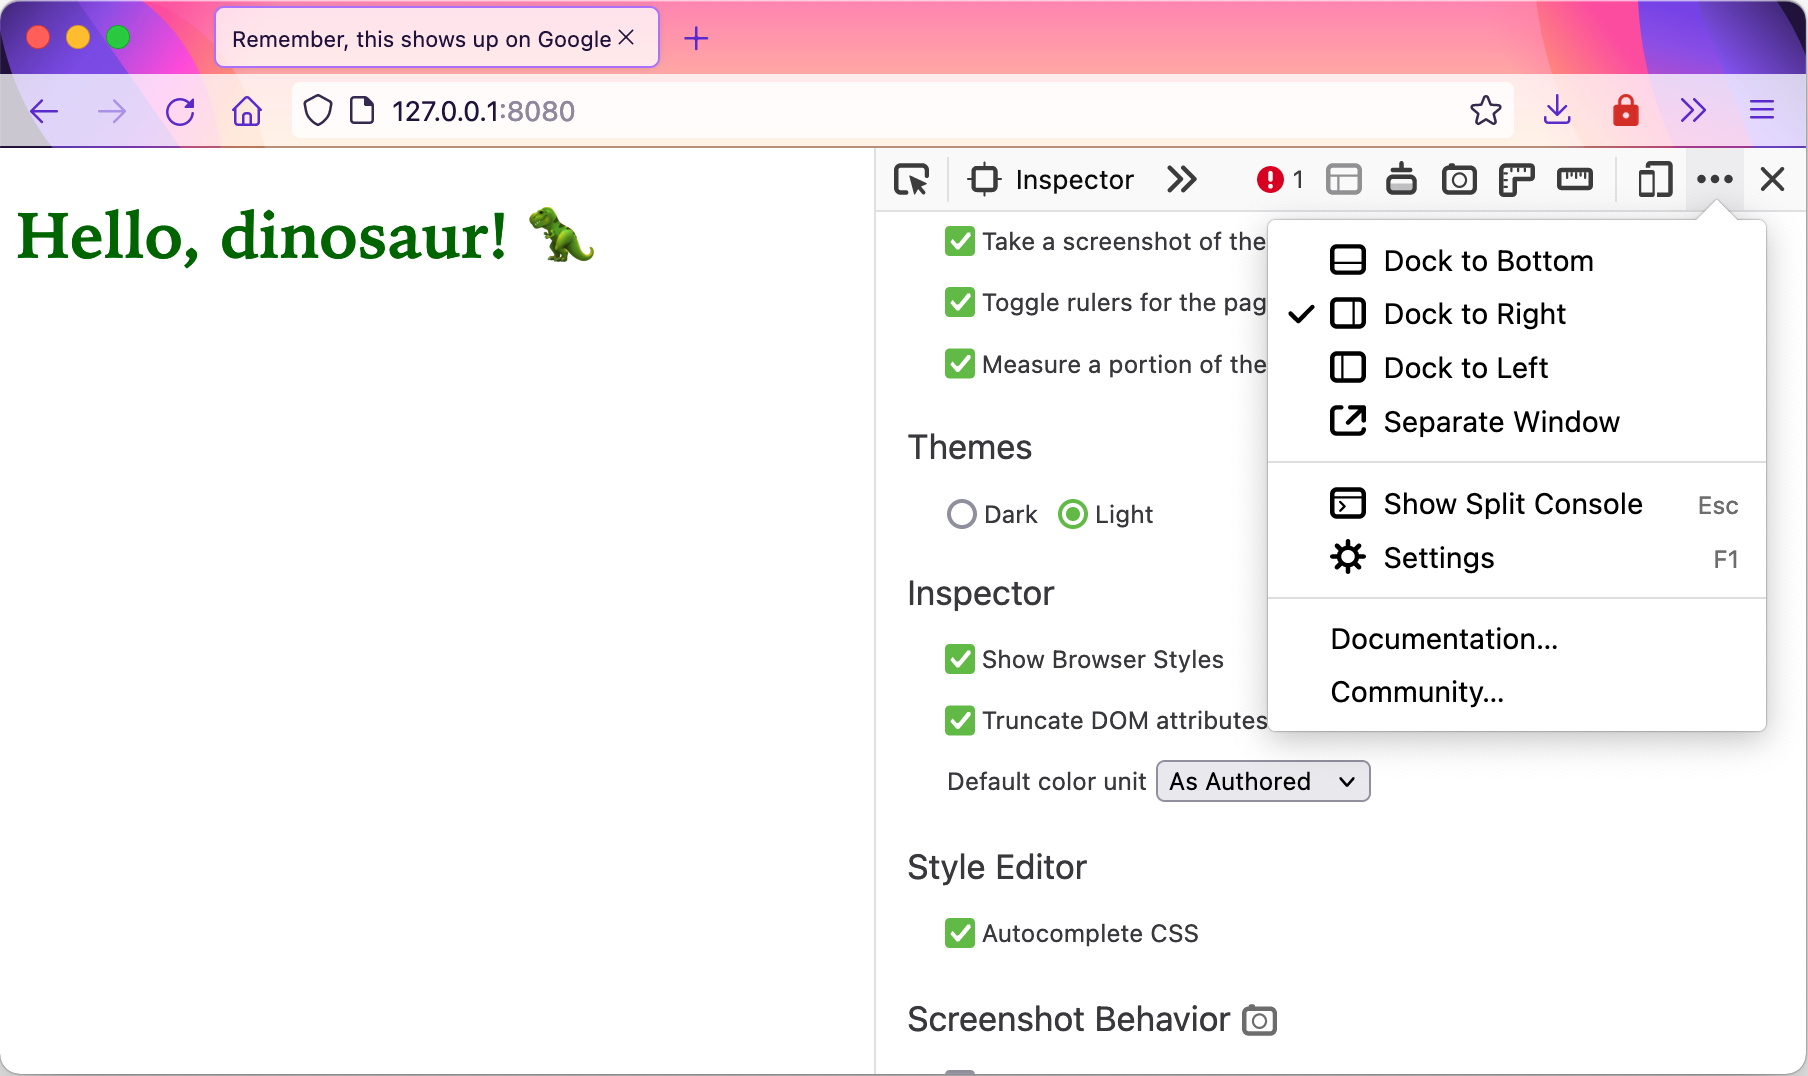
Devtools will also indicate if the style rule is from a user agent stylesheet. If you are using Firefox and do not see any user agent styles, click on the 3 horizontal dots at the top-right corner of Devtools to pull up the Devtools settings. Make sure Show Browser Styles is checked.
Every browser will also provide a visualisation of the box model for the highlighted element. Chrome and Edge display this under the Styles tab, Firefox displays it under Layout and Safari shows it under Computed.
There are some features that only certain browsers’ Devtools support at the moment, and we will cover these in the later sections when we discuss the relevant feature. Every browser vendor has dedicated teams working on their respective Devtools, so the official documentation is fairly comprehensive and a good resource to familiarise yourself with the available features:
Welcome! Unfortunately, you don’t have access to this lesson. To get access, please purchase the course or enroll in Magical Dev School.
Unlock this lesson